

Successful trading depends on understanding what is happening in the market as trades occur. While price charts reveal the broader trend, they do not show the details behind every executed transaction.
This is where time and sales (T&S) data becomes valuable. It displays real-time trading activity, allowing traders to monitor executed prices, trade sizes, direction, and timing as orders move through the market.
By combining this information with technical analysis, traders can develop a clearer view of buying and selling pressure and make better-informed decisions.
What Is Time and Sales Data?
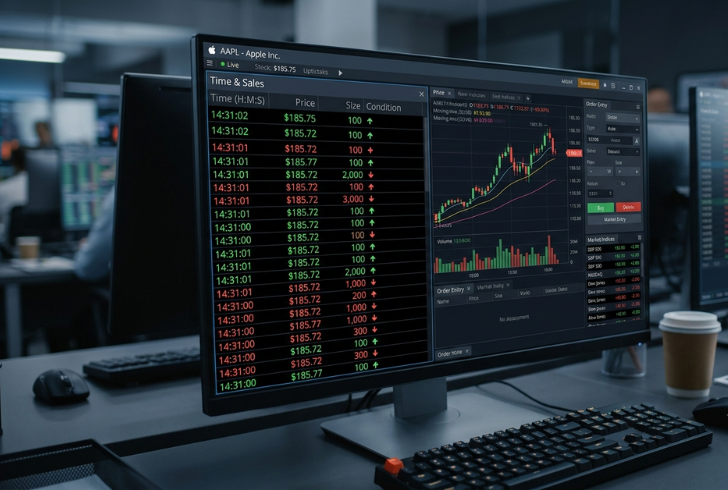
Time and sales, often called T&S, is a live record of completed market transactions. Every entry provides key information about a trade, including the execution price, trade volume, trade direction, exact time, and the exchange where the transaction took place. Instead of showing pending orders, T&S focuses only on trades that have already been executed.
Before electronic trading became standard, investors relied on ticker tape machines to follow market activity. Modern trading platforms have replaced those systems with digital time and sales windows that update instantly as new trades occur.
This real-time information gives traders a closer look at market participation than traditional price charts alone.
How Time and Sales Works
Most trading platforms include a dedicated time and sales window that lists completed trades in chronological order. Each trade appears in a table with separate columns showing the date and time, execution price, price movement, trading volume, and exchange.
Many platforms also use color coding to identify where trades occurred relative to the current bid and ask prices. Traders can often customize the display by adding filters for minimum trade size, price range, or trading volume, making it easier to focus on the transactions that matter most.
Some time and sales information also appears on electronic ticker displays. A standard ticker entry usually contains:
1. Stock symbol
2. Number of shares traded
3. Executed price per share
4. Upward or downward triangle showing whether the price is above or below the previous trading day’s closing price
5. Numerical difference between the executed price and the previous close
Electronic ticker systems typically display higher prices in green, lower prices in red, and unchanged prices in blue or white. Before 2001, U.S. stock prices were quoted in fractions. Since 2001, all prices have been displayed in decimal format.
Understanding Time and Sales Through an Example
A practical example makes the concept easier to understand.
Suppose the time and sales window reports that a buy order for 100 shares of XYZ stock was executed on the NASDAQ at 12:31:54 EST for $65.84. The data also shows that this execution price was $0.01 higher than the previous completed trade.
This single entry tells traders exactly when the transaction occurred, how many shares changed hands, where the trade was executed, and how the latest price compares with the previous one.
Using Time and Sales in Trading Decisions

Time and sales data supports several trading approaches, particularly technical analysis. While fundamental investors evaluate a company’s financial health to estimate its intrinsic value, technical traders study market behavior by analyzing price movement and trading volume. T&S data adds another level of detail by revealing every completed transaction as it happens.
Charts such as bar charts and candlestick charts summarize price action over selected time periods. These charts help traders identify chart formations such as the handle, double bottom, and Hikkake patterns. However, charts combine multiple trades into a single visual representation.
Time and sales data fills that gap by displaying every executed trade individually. When both tools are used together, traders gain a more complete understanding of price action, trading activity, and short-term market momentum.
What Traders Watch in Time and Sales Data
The continuous stream of updates can appear overwhelming, especially for beginners. A practical starting point is observing the relationship between price movement, trading volume, and trade frequency before placing any orders.
Many traders watch for sudden spikes in trading volume or changes in the speed of executed trades. These movements can signal stronger buying or selling pressure. Time and sales works best with stocks that have high trading volume because active markets generate clearer trading data.
Time and sales provides a live record of completed trades. It shows the exact price, trade size, execution time, and order flow. This information adds detail that standard price charts cannot show.
The continuous stream of updates can seem overwhelming for beginners. With regular practice, traders can spot changes in market momentum more easily. This helps support better trading decisions.